
Full article
Full article text extracted for easier reading in-app.
Where did mortgage rates land at the end of October?
The national average for a 30-year fixed mortgage fell to 7.24% in the week ending October 29. A week earlier it was 7.32%, according to Freddie Mac’s weekly survey. That is a modest improvement for […]
LeeAnn Reynolds · AOL

LeeAnn Reynolds
The national average for a 30-year fixed mortgage fell to 7.24% in the week ending October 29. A week earlier it was 7.32%, according to Freddie Mac’s weekly survey. That is a modest improvement for buyers who are running the numbers on a home.
On October 28, a day before that reading, the Federal Reserve kept its federal funds target range at 3-3/4 to 4 percent on a 10 to 2 vote. Both dissents pointed the same way. Lisa D. Cook and Beth M. Hammack wanted to raise the range by 1/4 percentage point at that meeting. The hold, and the tighter policy those two dissenters preferred, form the policy backdrop for this week’s mortgage numbers.
Related: Today’s mortgage rates
What a lower average looks like on paper
Here is a hypothetical example, not an actual borrower or offer. A $400,000 30-year fixed loan at the new survey average carries monthly principal and interest of $2,725.99. At the prior week’s average, the same loan would cost $2,747.72, so the payment is $21.73 lower. The figures leave out taxes, insurance, mortgage insurance, points, fees and closing costs. Sam Khater, Freddie Mac’s chief economist, said the average declined again, “reaching its lowest level this month and modestly boosting purchasing power for prospective buyers.”
Where posted quotes landed
Most of the lender-posted quotes in RateZip’s tracking did not change during the week. The changes that did show up were small, and some were up while others were down. Rocket Mortgage’s 30-year fixed slipped 0.125 percentage point between October 26 and October 30. U.S. Bank’s jumbo 30-year fixed rose by the same amount over the same days.
Posted 30-year fixed rates covered a wide range, from AmeriSave’s 5.99% to New American Funding’s 7.5%. Lenders build these quotes on different assumptions about credit, points, fees, loan size and eligibility. So the range is not a set of competing offers open to any one borrower. The survey figure is a national interest-rate average, not a quote any particular lender offers, so it need not equal any one lender’s advertised rate.
Set against Treasury yields
The 10-year Treasury yield is the benchmark that long-term mortgage pricing tracks most closely. It closed at 4.98% on Thursday, October 29, down 2 basis points from the prior week’s last close, according to FRED data. On their last readings, Rocket Mortgage and Wells Fargo both posted 30-year fixed rates of 7.25%, and U.S. Bank posted 7.125%. All three are close to the survey average, and all three are well above the Treasury yield. These are levels on different dates and products, not proof of how lender pricing responds to Treasury moves. For someone holding a posted quote up against the headline average, a quote that lands near the survey figure says nothing about the points, fees or credit profile behind it. Those terms still decide what the loan costs.
What the Fed left open
In its statement, the Federal Reserve said inflation remains elevated. It said gathering more information will help it decide what policy is needed to bring inflation back to its 2 percent goal in a timely way. The committee did not say when its target range might change.
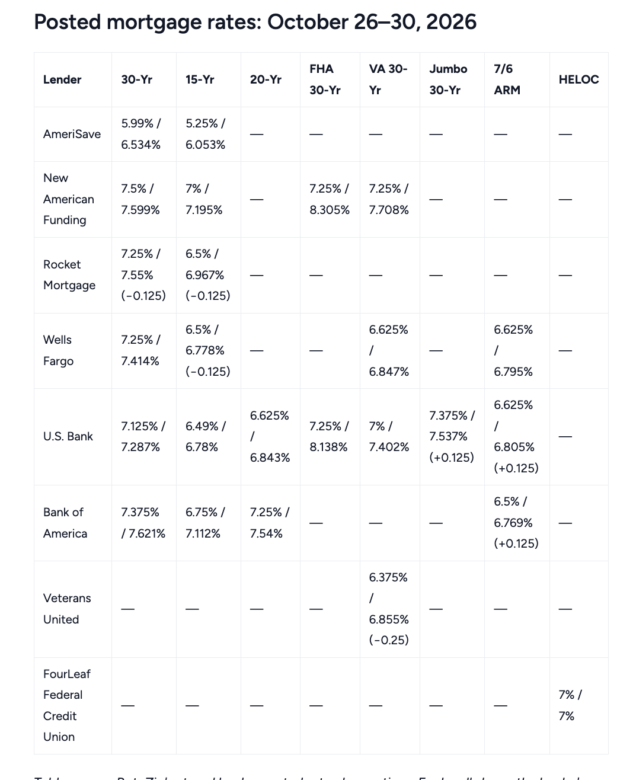
Table source: RateZip’s stored lender-posted rate observations. Each cell shows the lender’s final posted rate / APR of the week. Parentheses show the change from its first to last reading that week; a dash means no stored observation for that product in this reporting week. These advertised rates use different credit, points and loan-size assumptions and are not personalized offers.
See our rate methodology.
For closed-end mortgages, APR includes interest and certain loan charges; HELOC APR excludes fees. Adjustable-rate APR is not a maximum future rate. See the CFPB explanation.
National mortgage-rate benchmark cited in this article. Source: Freddie Mac Primary Mortgage Market Survey via FRED®, Federal Reserve Bank of St. Louis.
RateZip is operated by Peklava LLC, DBA RateZip, a licensed mortgage broker (NMLS ID 1592292). We are compensated by some of the partners shown, which may affect which offers appear and where. It does not affect our reporting or recommendations. See our editorial standards.
RateZip is operated by Peklava LLC, DBA RateZip, a licensed mortgage broker (NMLS ID 1592292). We are compensated by some of the partners shown on this page, which may affect which offers appear and where. It does not affect our reporting or our recommendations. Rates shown were last updated October 31, 2026 at 9:50 a.m. ET. See our editorial standards and how we use AI.
How we track rates: methodology. Found an error? Tell us.
Ask us! What questions do you have about content, strategy, pop culture, lifestyle, wellness, history or more? We may use your question in an upcoming article!
Like MediaFeed’s content? Be sure to follow us.
This article originally appeared on RateZip and was syndicated by MediaFeed.co.